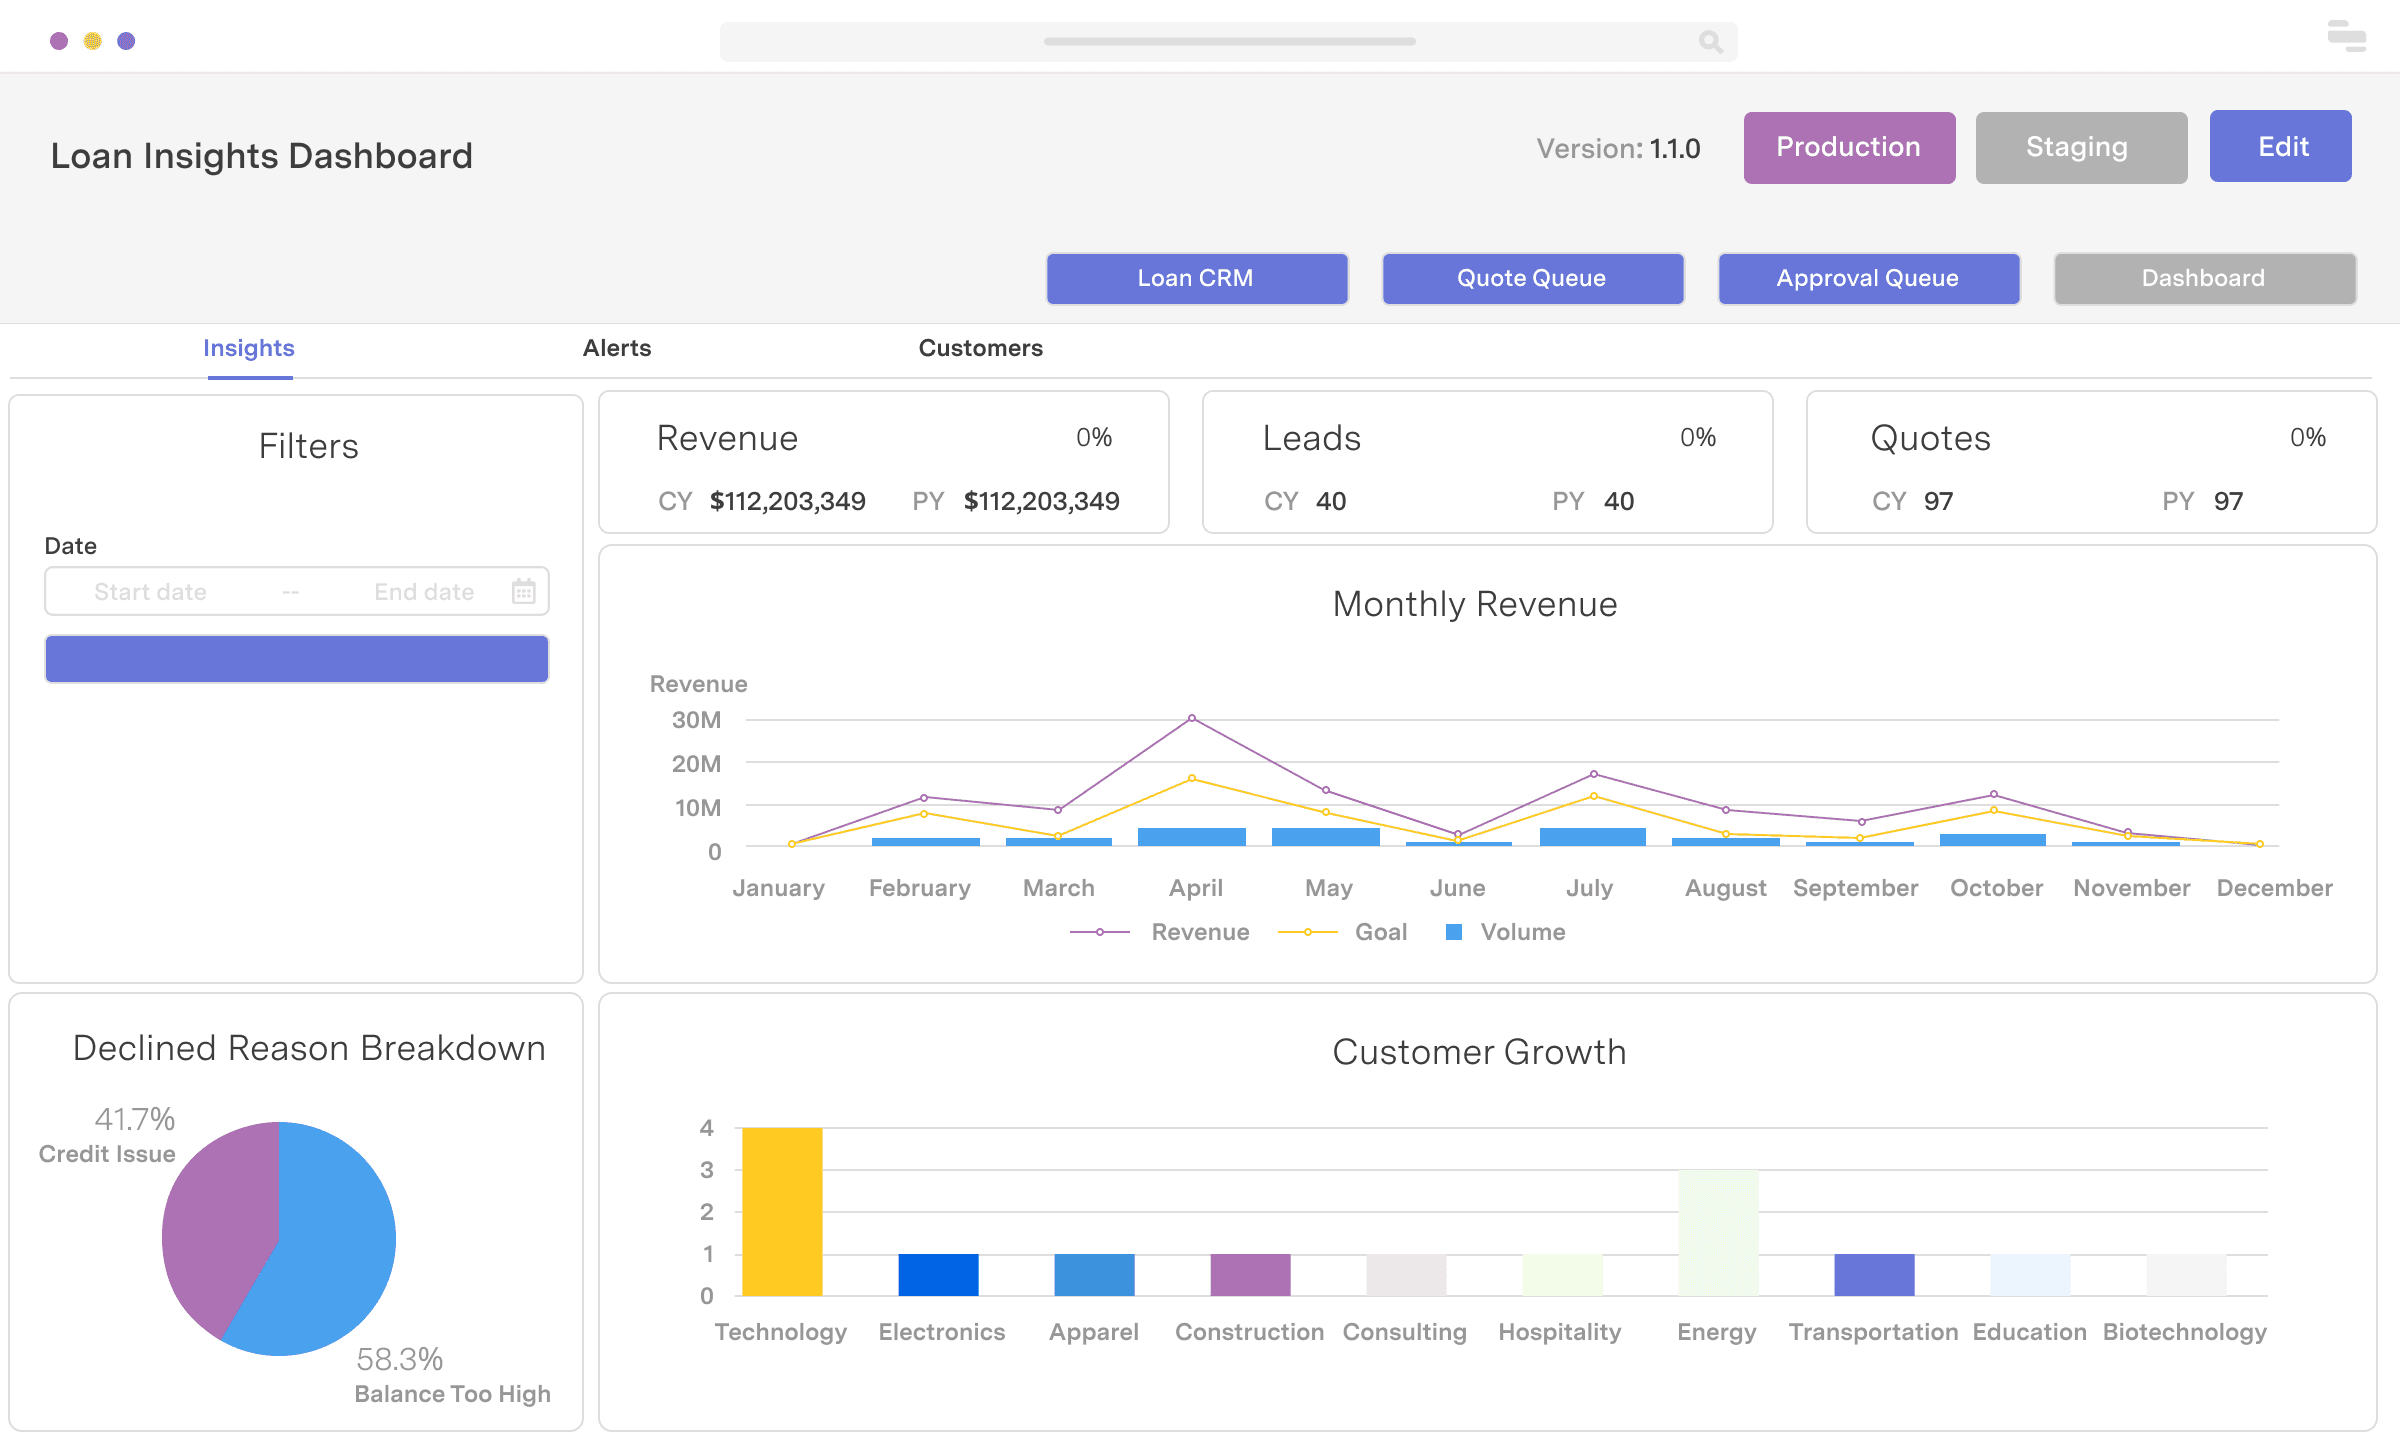
Loan insights dashboard
With Retool chart components, you can quickly build interactive charts on top of your data or APIs while also tapping into the customizability of the Plotly.js charting library for more advanced use cases. The example below is inspired by a real-world loan metrics dashboard.
Industry
End users
Components
Components
Build from a handful of drag-and-drop components
Data source
Connect Retool to a data source or API where loan data can is stored. Retool works out of the box with popular databases like PostgreSQL, MySQL, MongoDB, and can be deployed on-prem for full control over security.
 1. Create resource
 2. Read data
 3. Connect data with UI
From startups to Fortune 500s, the world's most effective teams use Retool to build custom business software. Our customers


“Retool is incredible. It's been a critical for our ops from the start, and is the reason we’re able to scale so quickly. And the on-prem version with access controls & audit logs makes it easy to meet our compliance requirements.
Retool is incredible. It's been a critical for our ops from the start, and is the reason we’re able to scale so quickly. And the on-prem version with access controls & audit logs makes it easy to meet our compliance requirements.
Pedro Franceschi
Co-founder and CTO at Brex
Supercharge your business today.
Start building an internal tool or customer portal in under 10 minutes.